Behavioral AI for better trading returns
Hoc-Trade builds TradeMedic™ AI, the first platform to detect and quantify behavioral trading patterns. Built on the analysis of 500,000+ real trader accounts.
You consistently capture reversals at turning points. In 124 trades, this pattern added +12,847 EUR to your performance.
On days where you placed more than 12 trades, your performance dropped significantly. In 203 trades, overtrading cost you -36,826 EUR.
Your trading data tells a story
Trading psychology drives more of your results than any strategy. TradeMedic™ analyses your real trade history and shows you both sides: what you're doing well, and what can be improved.
See your strengths and what can be improved
TradeMedic™ identifies 60+ behavioral and strategic patterns in your trading. See which strengths drive your performance the most, and which improvement opportunities cost you the most. Every finding backed by your real trades.
Your numbers, not generic advice
Every insight is calculated from your actual trades. Whether you cut winners short under pressure. How your performance shifts after consecutive losses. Where you deviated from your rules and what it costs you.
Track your improvement over time
Your report updates with every new trade, so you can see whether you're improving across multiple timeframes. Real accountability from your own data, not a journal you forget to fill in.
Revenge trading: hiding in plain sight
Trades placed within minutes of a loss consistently underperform. The most dangerous window is the first 15 minutes. On average, traders affected lose USD 1,917 to revenge trading.
This is one of 60+ patterns TradeMedic™ detects, each one backed by real trade evidence.
From data to insights
Latest research and insights
Confirmation Bias in Trading: Why Traders Ignore What the Market Is Telling Them
You checked the charts. Read the analysis. Consulted multiple sources. And you were still wrong, because you selected those sources precisely because they agreed with you. That is confirmation bias in trading.
How Distracted Trading Erodes Your Edge
When your attention splits, your edge deteriorates. Distracted trading creates cascading small errors that compound into significant performance loss. Discover how to create a distraction-free trading environment.
AI Trading Coach: What Actually Helps Traders Improve and What Just Tracks Your Losses
Not all AI trading tools improve your trading. Some just track it. The difference between an AI that shows you a chart and one that changes your behaviour is the difference between data and coaching.
Selective Trading: How Trading Less Improves Results
Most traders assume more trades mean more opportunity. The data says otherwise. TradeMedic's analysis of 500,000+ accounts shows that restraint, when it reflects real selectivity, concentrates profits into fewer, stronger setups.
Outcome Bias in Trading: Why a Winning Trade Is Not the Same as a Good Trade
A winning trade is not the same as a good trade. Outcome bias convinces traders otherwise, leading to constant strategy changes and decisions driven by luck rather than logic.
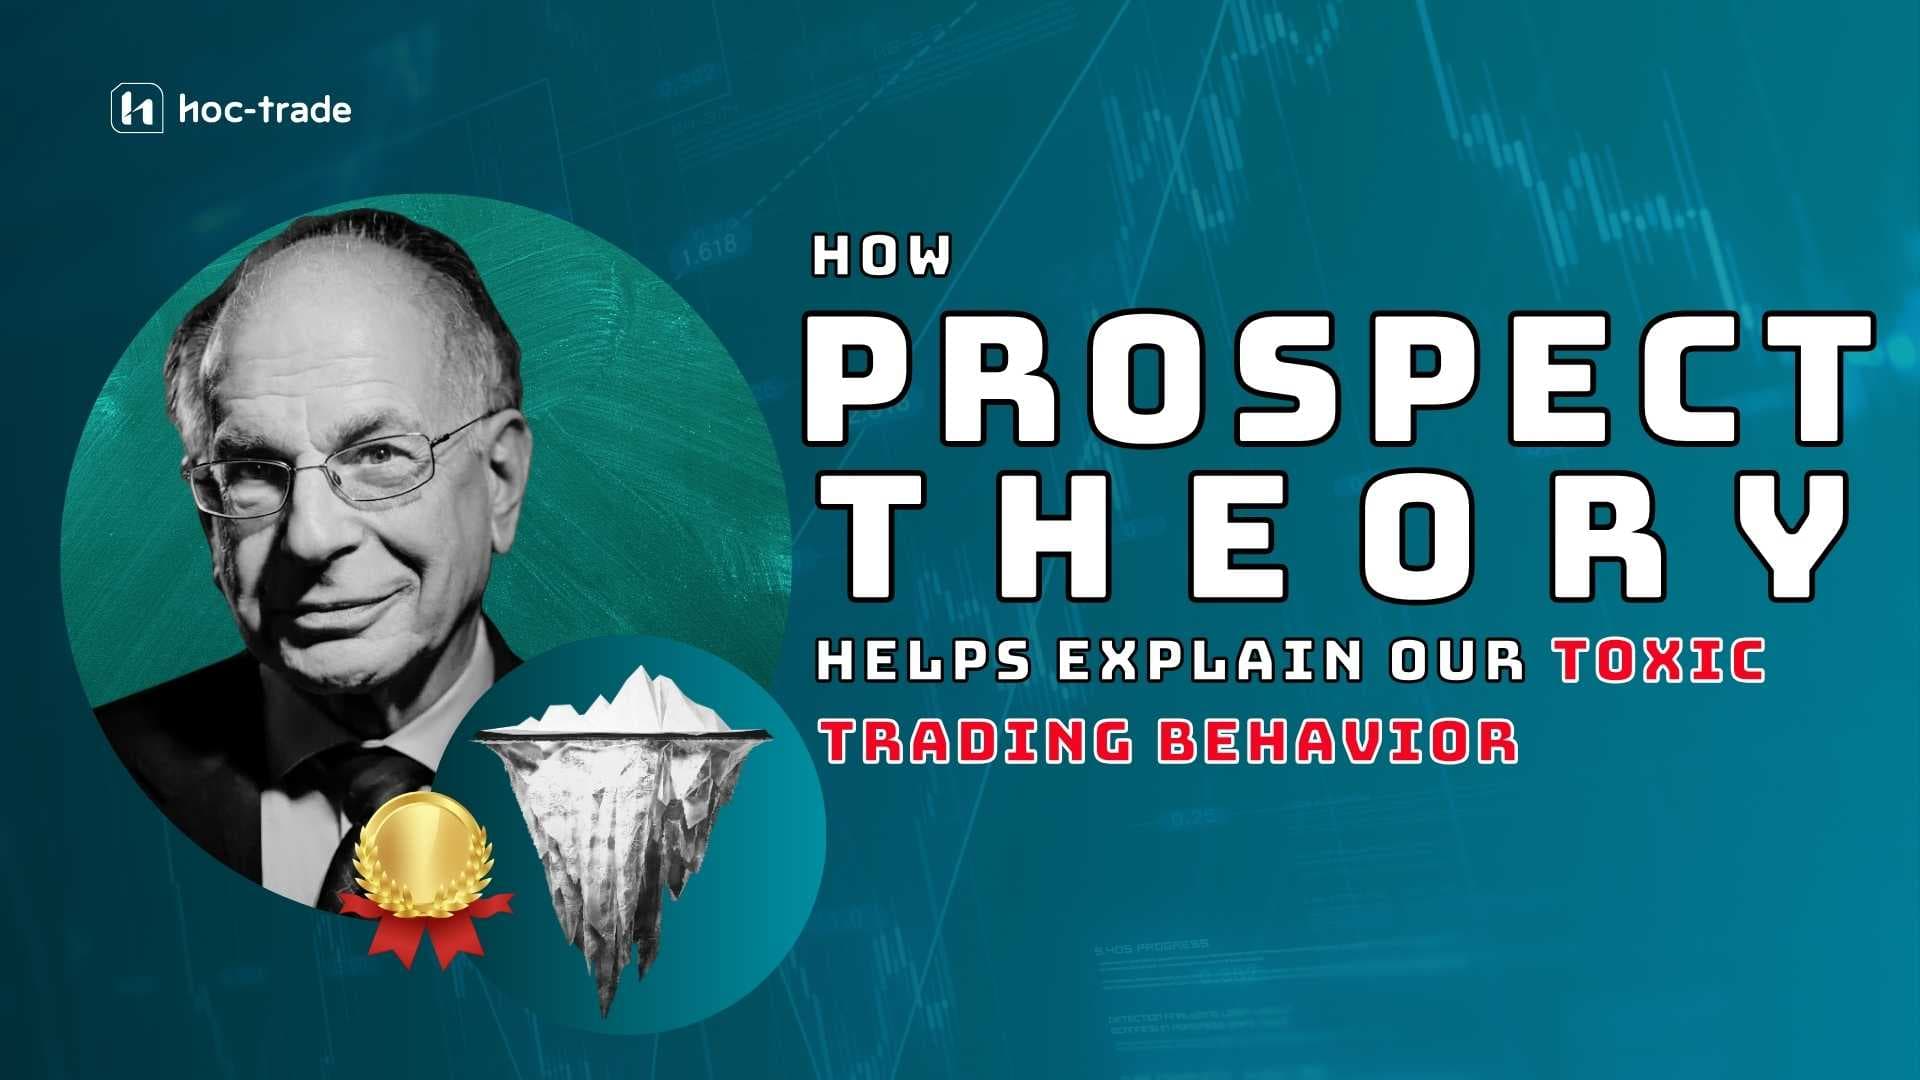
Loss Aversion in Trading: Why You Hold Losers and Cut Winners Short
Every trader knows the rule: cut your losses early, let your profits run. Prospect Theory explains why most do the opposite. Loss aversion drives traders to widen stop losses, close winners early, and erode their own returns.
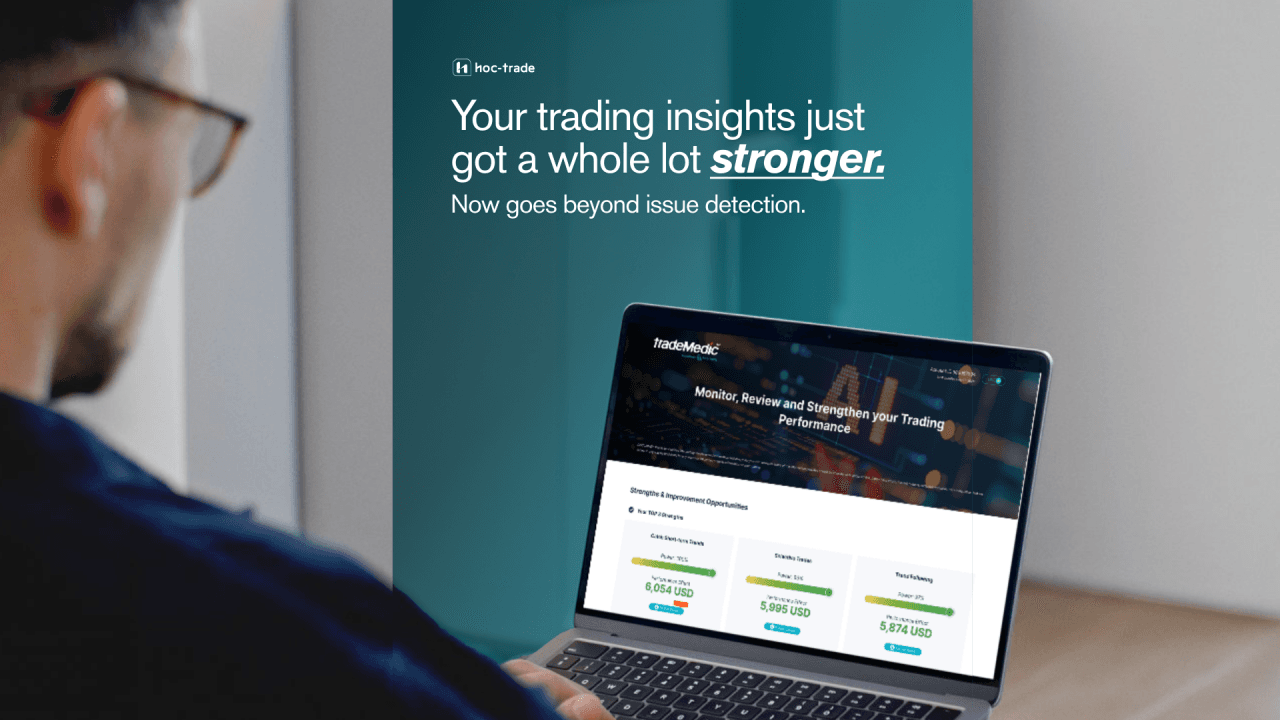
TradeMedic™ 2.0 : The Future of Trading is Smarter & Less Bias-Driven
TradeMedic 2.0 goes beyond flagging weaknesses. The upgraded report detects trading strengths, tracks performance shifts over time, and illustrates insights with real trade examples from your own account.
Reveal your trading patterns
Connect your trading account and receive a personalised behavioral analysis. Free trial, no payment required.
Analyse Your Trading →Retain your traders with behavioral insights
White-label TradeMedic™ for your platform. Automated behavioral reports for every trader on your client base.
Learn about partnership →